
How Can You Reverse Heart Disease?
Mar 25, 2026
Reverse Heart Disease? Is Plaque Regression Possible?
People ask me this all the time. "Dr. Alo, if I already have plaque in my arteries, is there any way to reverse it?"
For most of cardiology's history, the honest answer was: not really. We thought plaque was a one-way street. You build it up, you live with it. The goal was to slow the progression and hope for the best.
Nine clinical trials have now proven that view wrong (to a certain extent).
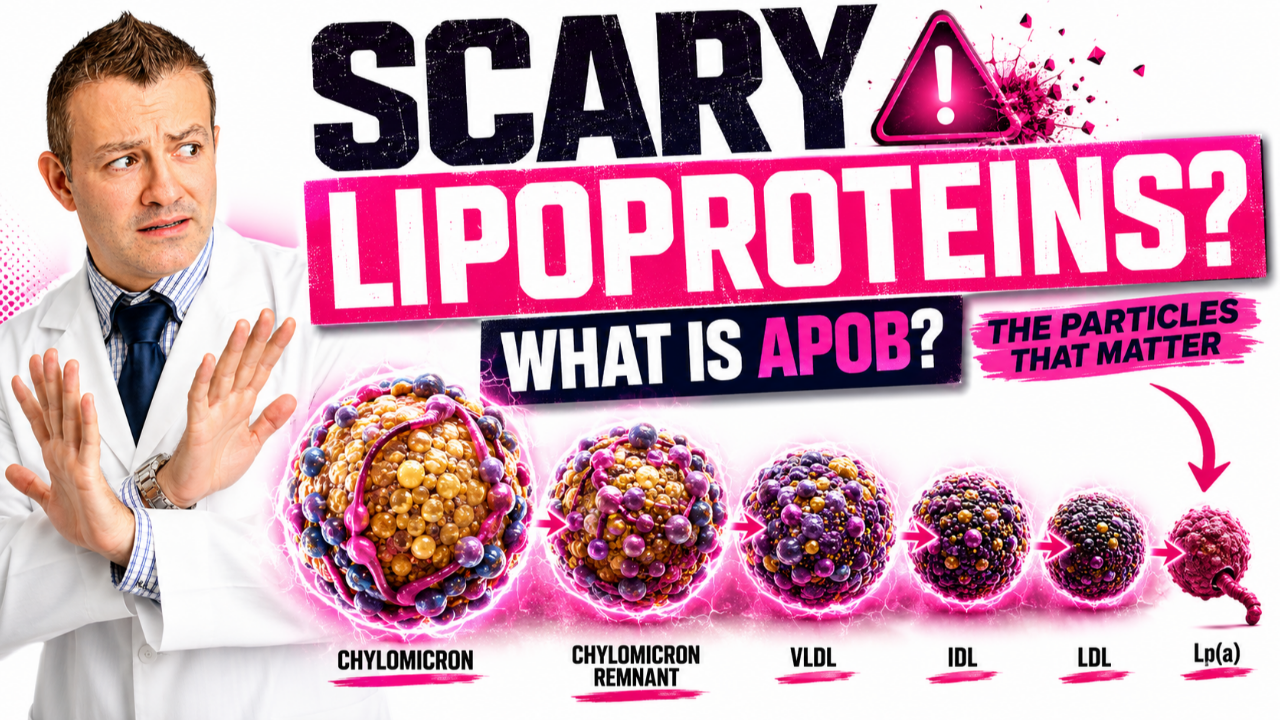
Using tiny cameras threaded directly into human coronary arteries, ultrasound probes, lasers, and infrared sensors measuring plaque in real time, researchers have watched cholesterol-lowering drugs literally shrink plaque, drain dangerous fat cores, and thicken the thin protective cap that stands between a stable plaque and a fatal heart attack.
This article covers every major plaque imaging trial in order, from 2004 through 2023. Each one builds on the last. Together, they tell one of the most important stories in modern cardiology (and it's still being written).
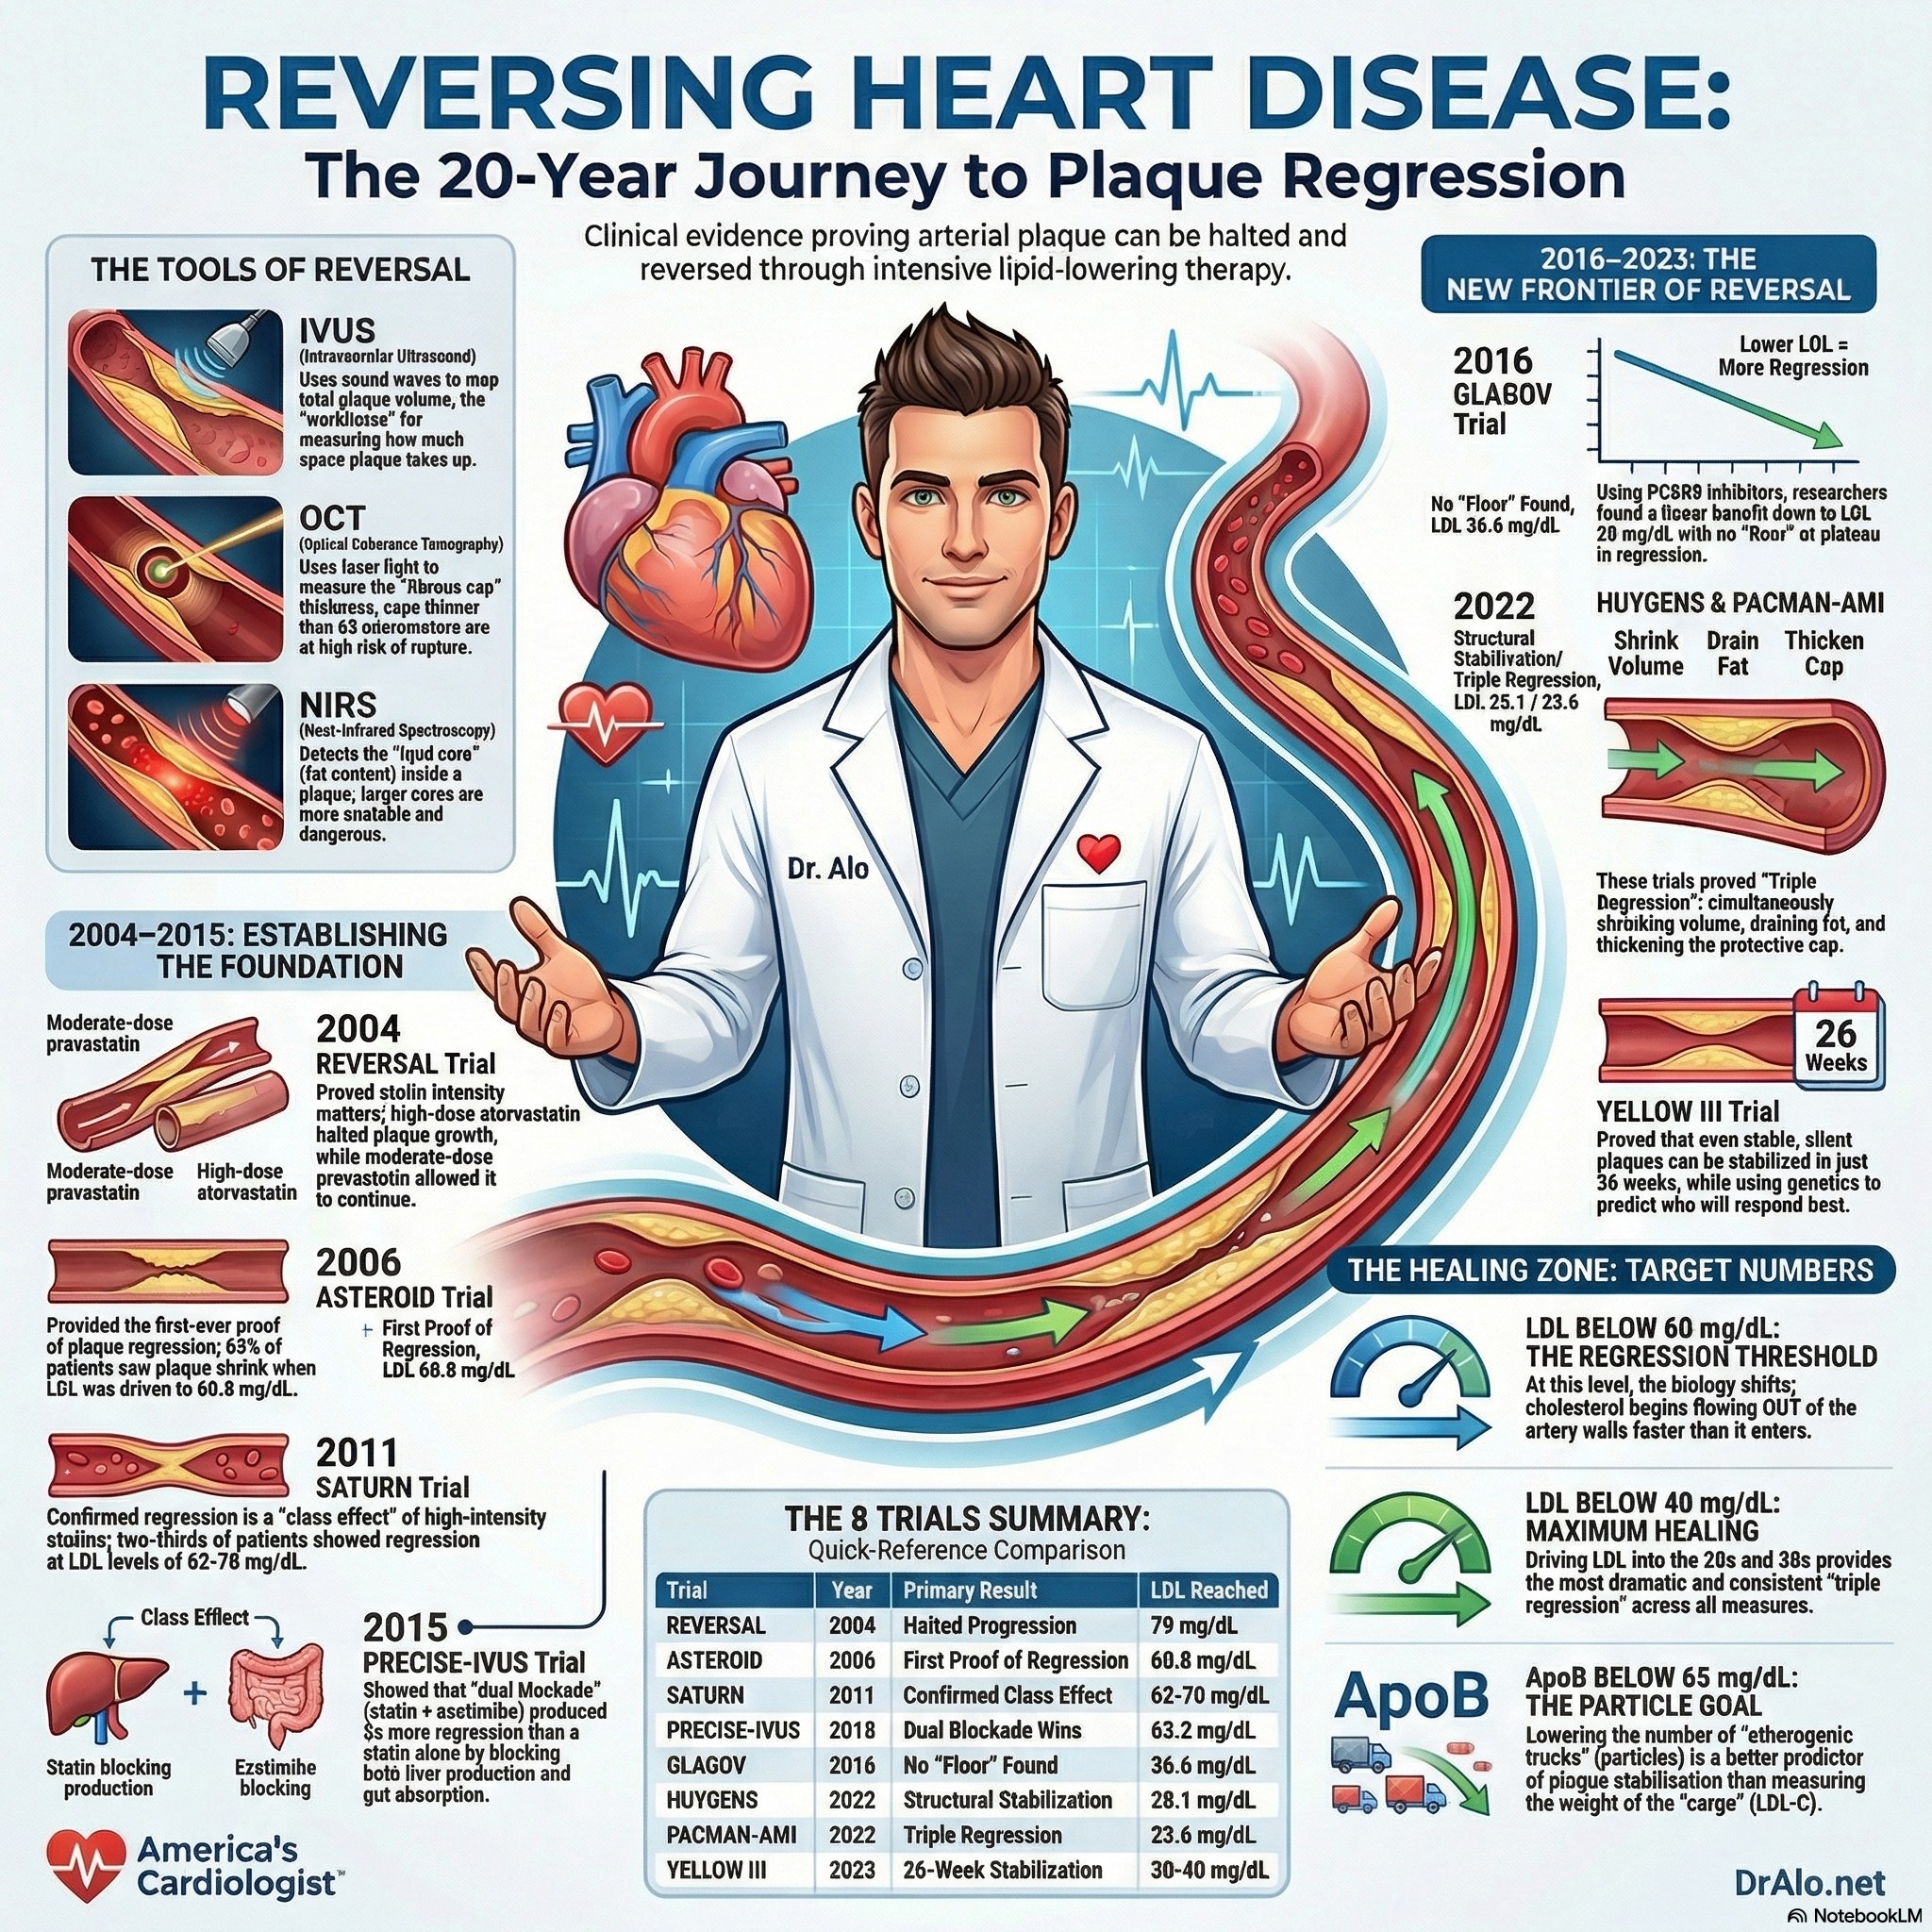
Infographic Summary: Plaque Regression Trials
First: Understanding the Imaging Tools
These trials used three different types of intracoronary cameras. Knowing what each one measures is essential to understanding the results.
IVUS (Intravascular Ultrasound) uses sound waves to map the total volume of plaque inside an artery. Think of it like sonar, it tells you how much plaque is physically taking up space. IVUS is the workhorse of plaque regression trials.
OCT (Optical Coherence Tomography) uses laser light, roughly 10 times sharper than IVUS, to measure the fibrous cap, the thin protective shell sitting on top of a plaque. A fibrous cap thinner than 65 micrometers is considered dangerously thin and prone to rupture. This is what causes most heart attacks: not a slow, gradual blockage, but a sudden rupture of a small-to-medium plaque.
NIRS (Near-Infrared Spectroscopy) detects the cholesterol and fat content inside the plaque, the lipid core. The bigger the lipid core, the more dangerous the plaque.
Most heart attacks are not caused by a slow buildup blocking the artery. They are caused by a plaque that ruptures suddenly, its thin cap tears, blood contacts the oily interior, and a clot forms instantly. The cap thickness is the most critical variable in determining rupture risk.
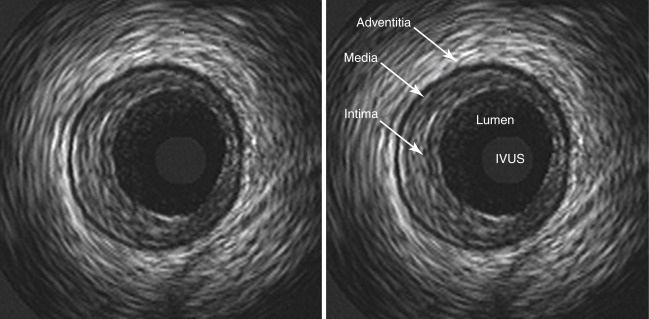
IVUS images pictured above. An ultrasound probe goes inside the artery.
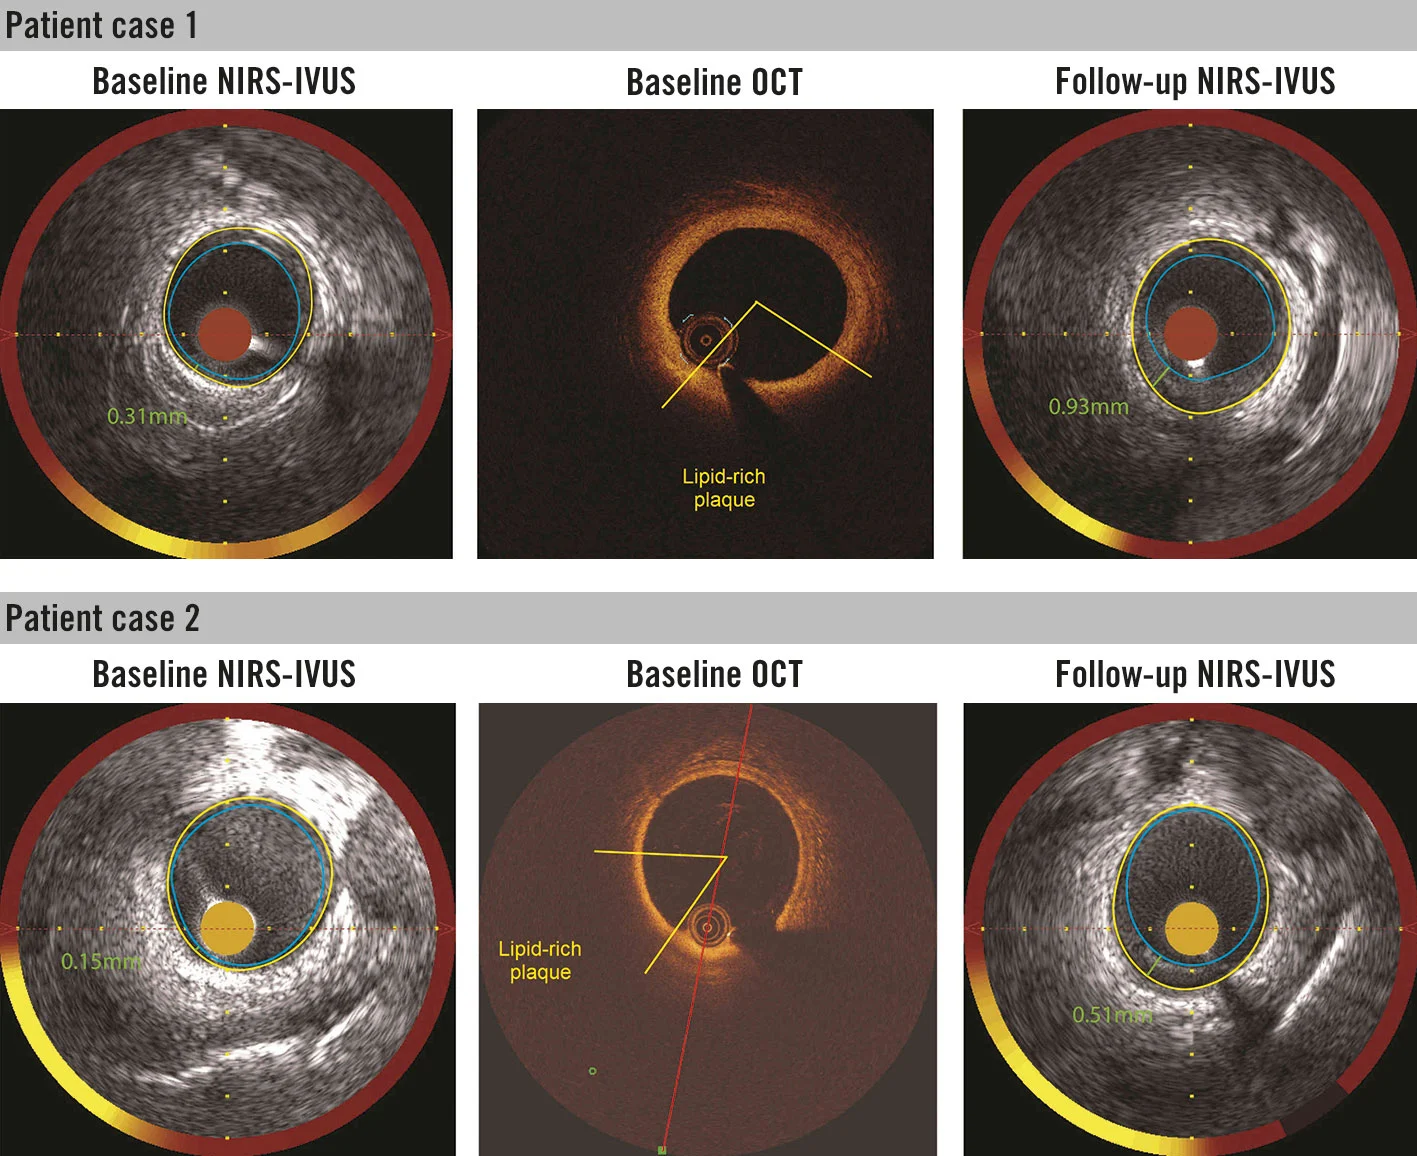 OCT and NIRS pictured above. The probe in inside the artery.
Note: These are very invasive imaging techniques and can not be used in large scale studies due to the inherent risk.
REVERSAL (2004) [ THE BEGINNING ]
The Big Question
Before REVERSAL, we knew statins reduced cardiovascular events. But we had not proven that different intensities of statin therapy produced different effects on plaque inside the arteries. Was more really better? REVERSAL was designed to find out.
What They Did
654 patients with confirmed coronary artery disease at 34 centers across the United States were enrolled. After an 8-week run-in period, all patients had their baseline plaque measured with IVUS. They were then randomized to either a moderate-intensity statin, pravastatin 40 mg, or a high-intensity statin, atorvastatin 80 mg, for 18 months. IVUS was repeated at the end.
Key numbers: Baseline LDL was 150 mg/dL in both groups. The pravastatin group finished at 110 mg/dL. The atorvastatin group finished at 79 mg/dL , a 28% additional reduction between the two arms.
The Results
Pravastatin group: Plaque continued to grow. Total atheroma volume increased by 2.7%, statistically significant progression (p=0.001). The moderate statin was not enough to stop the disease.
Atorvastatin group: Plaque growth essentially stopped. The change in total atheroma volume was -0.4%, which was not statistically different from zero (p=0.98). The high-intensity statin halted progression completely.
The difference between groups was significant (p=0.02), proving for the first time that statin intensity, not just statin use , mattered for arterial biology.
The CRP finding: C-reactive protein, a marker of inflammation, fell by 5.2% with pravastatin but by 36.4% with atorvastatin. This suggested the arterial benefits of high-intensity statins went beyond pure cholesterol lowering, the anti-inflammatory effect of high-dose atorvastatin appeared to contribute independently to slowing plaque.
REVERSAL established the foundational rule: the intensity of statin therapy determines the arterial response. Moderate is not the same as intensive. But even the best statin in the trial , atorvastatin 80 mg at an LDL of 79 mg/dL only halted progression. It did not reverse it.
Atorvastatin 80 mg halted plaque progression; pravastatin 40 mg did not. CRP fell 36.4% vs 5.2%. LDL 79 mg/dL was enough to stop progression, but not yet enough to cause regression.
ESTABLISH (2004) [ FASTEST REGRESSION EVER: 6 MONTHS POST-HEART ATTACK ]
The Big Question
REVERSAL and ASTEROID both studied stable patients with coronary artery disease who had never had a recent heart attack. But what happens to plaques immediately after an acute coronary syndrome? The artery is biologically activated, inflamed, and vulnerable. Could early, aggressive statin treatment in the immediate post-heart attack period produce rapid plaque regression, and faster than in stable disease? ESTABLISH was the first trial to test this directly.
What They Did
70 patients with acute coronary syndrome who had just undergone emergency PCI were enrolled at a single center in Japan. Immediately after PCI to treat the culprit lesion, patients were randomized to either intensive lipid lowering with atorvastatin 20 mg daily or usual care (diet, with a cholesterol absorption inhibitor added only if LDL remained above 150 mg/dL). Serial IVUS was performed in a non-stented, non-culprit site of the culprit vessel at baseline and again at 6 months. 48 patients had evaluable IVUS at both time points: 24 in each group.
Why the non-culprit vessel? The ESTABLISH investigators were deliberately imaging a plaque that had not been mechanically disrupted by the stenting procedure. They wanted to know what pharmacological lipid lowering alone, without any intervention, did to vulnerable plaques that remained elsewhere in the same artery.
LDL changes: The atorvastatin group reduced LDL by 41.7% from baseline. The control group, receiving only dietary advice, actually saw LDL increase by 0.7% over the same period, reflecting the natural post-ACS inflammatory cholesterol response.
The Results
-13.1% vs. +8.7%
Plaque volume change: atorvastatin vs. control
p<0.0001 — plaque shrank by 13% in 6 months while control plaques continued to grow
The magnitude of regression: A 13.1% reduction in plaque volume in just 6 months was the fastest and largest plaque regression ever documented with IVUS at that time. This was not seen in the stable-disease statin trials. REVERSAL produced only halting of progression in 18 months. ASTEROID produced regression of roughly 1% PAV over 24 months. ESTABLISH produced a 13% absolute plaque volume reduction in half that time, in a far smaller trial, suggesting something fundamentally different was happening in the post-ACS biological environment.
The dose-response: Percent change in plaque volume correlated significantly with the degree of LDL reduction achieved (R=0.612, p<0.0001). Even more importantly, this relationship held even in patients whose baseline LDL was below 125 mg/dL, which at the time was considered low. This was an early indication that even patients with seemingly well-controlled LDL could benefit from further reduction immediately after an acute coronary syndrome.
Why does post-ACS produce faster regression? The ESTABLISH investigators proposed that the explanation lies in the biology of ACS plaques. Immediately after a heart attack, the coronary arteries contain a high proportion of lipid-rich, macrophage-laden, actively inflamed plaques with thin fibrous caps, large lipid cores, and enormous biological activity. These are the plaques with the most cholesterol available for efflux, the most inflammatory cells responding to LDL lowering, and therefore the most room for rapid improvement. Stable-disease plaques are quieter and more fibrotic, meaning they change more slowly. Post-ACS plaques are essentially primed for regression when cholesterol is removed aggressively.
ESTABLISH proved what later trials like HUYGENS and PACMAN-AMI would confirm at much larger scale: post-ACS patients have the most active, most responsive plaques in the coronary circulation. Early, aggressive lipid lowering in this setting produces the fastest and most dramatic regression ever seen with any cholesterol-lowering therapy. This is the biological rationale for starting a PCSK9 inhibitor within 24 hours of a heart attack, as done in PACMAN-AMI.
Plaque volume -13.1% (atorvastatin) vs. +8.7% (control) in just 6 months. Fastest regression ever documented by IVUS. LDL reduction correlated directly with degree of regression even at low baseline LDL.
ASTEROID (2006) [ FIRST PROOF OF REGRESSION ]
The Big Question
REVERSAL left a critical question unanswered. Atorvastatin at 80 mg got LDL to 79 mg/dL and stopped progression. But could a more potent statin, driving LDL even lower, actually reverse the disease? ASTEROID tested rosuvastatin 40 mg, at the time the most potent statin available, without a placebo or comparison arm. The question was simple: take a group of patients, drive LDL as low as this drug can go, and see if plaque regresses.
What They Did
507 patients at 53 centers across the United States, Canada, Europe, and Australia underwent baseline IVUS imaging of a coronary artery not previously treated with a stent. All patients received rosuvastatin 40 mg daily for 24 months, then underwent repeat IVUS. Crucially, most patients were statin-naïve at enrollment, their plaques had never been exposed to lipid-lowering therapy. There was no placebo arm; the trial used each patient as their own control, comparing their 24-month plaque to their own baseline.
LDL at baseline: 130.4 mg/dL. LDL at 24 months: 60.8 mg/dL, a 53.2% reduction. At the time, this was the lowest mean LDL ever achieved in a major statin outcomes trial. 75% of patients reached LDL below 70 mg/dL.
HDL simultaneously rose from 43.1 to 49.0 mg/dL, a 14.7% increase. This was the largest HDL increase ever observed in a major statin trial at that time. We now know that HDL plays no role and is not a marker of concern. However, at the time this was heralded as a huge win because not many drugs increased HDL.
The Results
-0.98%
Mean reduction in percent atheroma volume (PAV) in 24 months of intense lipid lowering therapy!
Statistically significant vs. baseline (p<0.001) , the most rigorous IVUS measure of plaque burden
Regression rates: 63.6% of patients showed regression in percent atheroma volume; 36.4% showed progression. For the first time in a large clinical trial, a majority of patients with coronary disease had their plaque shrink.
Most diseased segment: The 10mm subsegment with the highest disease burden at baseline saw a mean reduction of 6.1 mm³ in atheroma volume, the regions most at risk regressed the most.
Total atheroma volume: Fell by a mean of 14.7 mm³, a 6.8% median reduction across the entire imaged artery.
What made ASTEROID historic: Dr. Steven Nissen, presenting the data at the American College of Cardiology annual meeting in 2006, made the now-famous statement: "IVUS is not a surrogate for coronary atherosclerosis, it is coronary atherosclerosis. We are looking right at the disease, up close and personal. When we see less plaque after treatment, we believe it will be confirmed with a morbidity and mortality benefit."
The critical insight from ASTEROID: regression required getting LDL below 70 mg/dL, and specifically to around 60 mg/dL. This was below the guideline targets of the era, which considered 100 mg/dL acceptable and 70 mg/dL aspirational for very high-risk patients. ASTEROID moved the goalposts permanently. (See my article on the latest cholesterol treatment guidelines)
First definitive proof of plaque regression in a large clinical trial. LDL 60.8 mg/dL → PAV -0.98%. 63.6% of patients regressed. Below 70 mg/dL was the threshold that made it happen.
SATURN (2011) [ HEAD-TO-HEAD: THE TWO BEST STATINS ]
The Big Question
ASTEROID proved regression was possible with rosuvastatin. But the most commonly prescribed high-intensity statin was atorvastatin 80 mg. Were these two drugs equivalent in their arterial effects? And could the trial confirm that regression with high-intensity statins was a reproducible, consistent finding across a large, multicenter population?
What They Did
1,039 patients with established coronary artery disease on angiography completed both baseline and 24-month IVUS exams, the largest IVUS plaque regression trial of the statin era. After a run-in period, patients were randomized to either rosuvastatin 40 mg or atorvastatin 80 mg for 24 months. Serial IVUS was performed at baseline and follow-up at 53 sites across multiple countries.
LDL achieved: Rosuvastatin reached 62.6 mg/dL. Atorvastatin reached 70.2 mg/dL, a statistically significant 7.6 mg/dL difference favoring rosuvastatin (p<0.001).
HDL achieved: Rosuvastatin raised HDL to 50.4 mg/dL; atorvastatin to 48.6 mg/dL. Both showed increases from baseline.
The Results
PAV (primary endpoint): Both drugs produced significant plaque regression compared to baseline. Atorvastatin: -0.99%. Rosuvastatin: -1.22%. The difference between the two groups was not statistically significant (p=0.17), both achieved comparable regression on the primary endpoint. It's important to note though that the more potent statin, with the lower achieved LDL-C, had more plaque regression, but the study was not long enough to show a statistical difference. Carried out on a long enough time horizon, their likely would have been a statistical difference. But both were good since they achieved fairly low LDL levels with direct, intravascular imaging proven plaque regression, though minimal. It was only a 24 month study, but still showed regression.
Total atheroma volume (TAV, secondary endpoint): Here rosuvastatin showed a statistically significant advantage: -6.39 mm³ vs. -4.42 mm³ with atorvastatin (p=0.01). The drug that drove LDL slightly lower produced slightly more total plaque regression on the secondary measure.
Regression rates: 63.2% of patients on atorvastatin and 68.5% on rosuvastatin showed PAV regression. For total atheroma volume, 64.7% and 71.3% respectively. In both groups, roughly two-thirds of patients had their coronary plaque shrink.
Plaque composition (VH-IVUS sub-study): A subset of 71 patients had detailed plaque composition analysis. Both drugs reduced fibro-fatty tissue volume (the active, inflamed, dangerous component that is more likely to rupture and cause a heart attack) and increased dense calcium volume (a more stable, chronic change). The necrotic core was not significantly changed by statins alone, an important finding that PCSK9 inhibitor trials would later address. (see below)
Safety: The adverse event rate was notably low, lower than many prior statin trials. These two are the "cleanest" statins with the least side effects and interactions. Dr. Nicholls stated at the AHA Scientific Sessions: "The most striking finding is the degree of regression in both groups... a much greater extent than we have ever observed in any other clinical trial." Further, there were no cases of serious muscle injury (rhabdomyolysis) were reported in either group.
SATURN's most important message: both maximum-dose statins produced meaningful plaque regression, confirming this was a class effect of intensive LDL lowering, not a quirk of any single drug. The drug that got LDL slightly lower (rosuvastatin) produced slightly more regression. The direction was clear: lower LDL = better arterial outcomes.
Both max-dose statins regressed plaque: atorvastatin -0.99%, rosuvastatin -1.22% PAV. Two-thirds of patients in both groups showed regression. LDL in the 60-70 mg/dL range = the effective regression zone for high-intensity statins.
PRECISE-IVUS (2015) [ ADDING EZETIMIBE: TWO PATHWAYS, MORE REGRESSION ]
The Big Question
Statins block cholesterol synthesis in the liver. But the gut keeps absorbing dietary cholesterol independently. This also applies to your own intrinsically synthesized cholesterol that is trafficked back to the gut for elimination. What if we blocked both pathways simultaneously, statin plus ezetimibe? Ezetimibe works in the small intestine, blocking a protein called NPC1L1 that absorbs cholesterol from food. The IMPROVE-IT trial had just shown that adding ezetimibe to a statin reduced cardiovascular events. PRECISE-IVUS asked: does the combination cause more plaque regression than statin alone?
What They Did
246 Japanese patients who had just undergone successful percutaneous coronary intervention (PCI, a stent procedure) for either acute coronary syndrome or stable angina were enrolled across multiple centers. All patients had LDL above 100 mg/dL at entry. They were randomized to atorvastatin alone (uptitrated with a goal of LDL <70 mg/dL) or atorvastatin plus ezetimibe 10 mg daily. Serial IVUS was performed at baseline and again at 9-12 months, measuring plaque in a coronary artery that had not been stented.
LDL achieved: The atorvastatin-only group reached 73.3 mg/dL. The combination group reached 63.2 mg/dL, a statistically significant additional 10 mg/dL reduction (p<0.001). Both groups dropped from a starting point above 100 mg/dL, but the dual blockade drove LDL significantly lower.
The Results
-1.4% vs. -0.3%
PAV reduction: ezetimibe + statin vs. statin alone
p=0.001 , the combination produced nearly 5 times more plaque regression
Regression rates: 78% of patients on the combination showed PAV regression, versus 58% on statin monotherapy (p=0.004). That is a 20 percentage point difference in the proportion of patients who actually reversed their disease.
Acute coronary syndrome subgroup: In the patients who had presented with an acute coronary syndrome (rather than stable angina), the benefit of combination therapy was even more pronounced. ACS patients on dual therapy showed the greatest regression, consistent with the finding in PACMAN-AMI that post-ACS patients have more active disease and more room for improvement.
The mechanistic question: An interesting analysis from PRECISE-IVUS raised a mechanistic nuance. When researchers looked at whether the LDL difference alone explained the greater regression, they found the linear relationship between LDL and PAV change was not as clean as expected. Statin-pretreated patients who then added ezetimibe showed significantly more additional regression than statin-naïve patients who just received atorvastatin to the same LDL level. One proposed explanation: statins increase cholesterol absorption from the gut as a compensatory mechanism, and ezetimibe specifically blocks this rebound, providing a synergistic benefit beyond simple LDL math.
The IMPROVE-IT connection: PRECISE-IVUS provided the imaging mechanism for the clinical benefit seen in IMPROVE-IT, the large outcomes trial that showed ezetimibe plus simvastatin reduced cardiovascular events compared to simvastatin alone. Now researchers could see exactly why: the combination was physically removing more plaque.
PRECISE-IVUS proved that dual lipid-lowering, attacking both cholesterol synthesis (statin) and cholesterol absorption (ezetimibe), produces meaningfully more plaque regression than either alone. The patients who benefited most were the highest-risk: those presenting after a heart attack. This is now standard practice in high-risk patients.
PAV -1.4% (combo) vs. -0.3% (statin alone). 78% vs. 58% regression rates. LDL 63.2 vs. 73.3 mg/dL. Dual blockade of synthesis + absorption > blocking synthesis alone.
GLAGOV (2016) [ PCSK9 INHIBITION: NO FLOOR FOUND ]
The Big Question
Statins and ezetimibe together could get LDL to the 60s. But PCSK9 inhibitors, monthly injections that block a protein responsible for clearing LDL receptors from the liver, could cut LDL by another 60% on top of that. For the first time, researchers could drive LDL into territory that had been pharmacologically impossible before. The question: does regression continue to improve at LDL levels no drug had ever reached? Is there a floor, a point at which going lower stops helping?
What They Did
968 patients with symptomatic coronary artery disease at 197 centers worldwide, the largest IVUS plaque trial ever conducted at that time. All patients were already on stable statin therapy. They were randomized to monthly subcutaneous injections of evolocumab 420 mg or placebo for 18 months. Serial IVUS measured plaque before and after.
LDL achieved: Statin-only placebo group: 93.0 mg/dL. Evolocumab combination group: 36.6 mg/d , the lowest mean LDL ever achieved in a randomized clinical imaging trial at the time.
The Results
PAV change: The statin-only group had essentially no net change: +0.05% (a tiny amount of progression). The evolocumab group showed regression of -0.95%. The difference was highly statistically significant.
64.3% vs 47.3%
Proportion of patients showing plaque regression
Evolocumab group vs. statin-only group , a 17 percentage point difference
The dose-response curve, the most critical finding: Researchers performed a LOESS regression analysis plotting the relationship between each individual patient's achieved LDL level and their plaque change. The result was unambiguous: a continuous, linear relationship between lower LDL and more regression, extending all the way from 110 mg/dL down to 20 mg/dL. There was no plateau. There was no floor. Every 10 mg/dL lower in LDL continued to produce additional regression.
The already-low LDL subgroup: Among patients whose LDL was already below 70 mg/dL at baseline on statin therapy alone, adding evolocumab still produced significantly more regression: 81% showed regression with the combination versus 48% without it. Even at LDL levels that most guidelines considered already well-controlled, there was substantial room for additional arterial benefit.
Plaque composition (VH-IVUS subset): In a smaller subset of patients with detailed composition analysis, evolocumab produced similar composition changes to those seen with high-intensity statins in SATURN, primarily increasing plaque calcification and reducing fibro-fatty tissue. The plaques were being reorganized into a more stable, chronic configuration.
GLAGOV answered the most important question in lipidology with imaging data: there is no floor. As long as LDL can be driven lower, plaque continues to regress, linearly, continuously, down to 20 mg/dL. This finding fundamentally changed the scientific rationale for very aggressive LDL targets.
PAV -0.95% evolocumab vs. +0.05% statin alone. 64% vs. 47% regression. Linear dose-response to LDL 20 mg/dL. No floor identified.
HUYGENS (2022) [ CAP STABILIZATION AFTER A HEART ATTACK ]
The Big Question
GLAGOV used IVUS, which measures plaque volume, in stable patients with relatively quiet plaques. But after a heart attack, the entire coronary circulation is biologically activated. Every artery contains inflamed, lipid-rich plaques, not just the culprit vessel that was stented. HUYGENS asked: in this high-risk post-heart attack population, can evolocumab not just shrink plaque volume, but fundamentally change plaque structure, specifically, the fibrous cap? And which lipid target best predicts who will benefit?
What They Did
161 patients who had just experienced an NSTEMI (a type of heart attack) were enrolled within days of their event. After the culprit vessel was stented, researchers imaged a separate, non-culprit artery using both OCT and IVUS, imaging plaque that was dangerous but had not yet caused a heart attack. Patients were randomized to evolocumab 420 mg monthly or placebo on top of maximally tolerated statins for 52 weeks. The artery was re-imaged at follow-up.
Why OCT as the primary tool: Previous trials had used IVUS, measuring volume. HUYGENS made fibrous cap thickness the primary endpoint for the first time. This was a deliberate clinical choice: most cardiologists now believe that cap thickness is a better measure of plaque danger than raw volume. A small plaque with a thin cap is often more dangerous than a large plaque with a thick cap.
LDL achieved: Evolocumab group: 28.1 mg/dL. Placebo (statin only): 87.2 mg/dL. A mean difference of 59.1 mg/dL.
The Results, Every Dimension Improved
+42.7 μm vs +21.5 μm
Fibrous cap thickening: evolocumab vs. placebo
Primary endpoint , double the protective cap growth with PCSK9 inhibition
Lipid arc (OCT): The circumferential extent of lipid inside the plaque, measured in degrees, fell by 57.5 degrees in the evolocumab group versus 31.4 degrees in placebo, nearly double the lipid drainage from the plaque interior.
Macrophage burden: The length of coronary artery containing macrophages, inflammatory cells that actively destabilize plaque by digesting the fibrous cap, fell by 3.17 mm in evolocumab patients versus 1.45 mm in placebo. The drug was reducing active arterial inflammation, not just pulling lipid out.
Plaque volume (IVUS): PAV fell by 2.29% in the evolocumab group versus 0.61% in placebo, greater regression than GLAGOV, likely because the post-ACS population had more biologically active plaques with more room for improvement.
The ApoB Sub-Analysis: The Finding That Changed My Practice
A post-hoc analysis examined outcomes based on whether patients achieved an ApoB level below 65 mg/dL, the European Society of Cardiology's target for very high-risk patients. Among 112 patients with both ApoB measurements and OCT data, 67 (60%) achieved the ApoB goal and 45 (40%) did not.
In patients who achieved ApoB <65 mg/dL: fibrous cap thickening was +44.6 μm. In those who did not: +24.9 μm. Nearly double the benefit, regardless of which treatment group they were in.
Lipid arc: Patients at goal showed -57.8 degree reduction in lipid arc versus -27.0 degrees in those not at goal. Again, nearly double.
TCFA reduction: Patients achieving ApoB <65 mg/dL were significantly less likely to have a thin-cap fibroatheroma, the most rupture-prone plaque type, remaining at 52-week follow-up.
ApoB measures the number of atherogenic particles in the blood, not their cholesterol content. It is a more precise measure of risk than LDL-C alone, especially in patients with insulin resistance or elevated triglycerides. HUYGENS proved that hitting an ApoB target below 65 mg/dL produces nearly double the plaque stabilization benefit compared to missing it. This is why ApoB should be measured and targeted, not just LDL.
Cap thickening +42.7 vs +21.5 μm. Lipid arc -57.5 vs -31.4 degrees. PAV -2.29% vs -0.61%. ApoB <65 mg/dL → nearly double the structural benefit.
PACMAN-AMI (2022) [ TRIPLE REGRESSION: ALL THREE DIMENSIONS AT ONCE ]
The Big Question
A dangerous plaque fails in three measurable ways simultaneously: it's too large in volume, its interior is loaded with fat, and its protective cap is too thin. Prior trials had measured one or two of these. PACMAN-AMI used all three imaging tools, IVUS, NIRS, and OCT, at the same time in every patient. The question: can aggressive lipid lowering achieve simultaneous improvement on all three measures? And does achieving all three translate to better outcomes?
What They Did
300 patients with acute myocardial infarction (both STEMI and NSTEMI) who had just undergone stenting were enrolled at 9 academic centers across Switzerland, Austria, Denmark, and the Netherlands. Within 24 hours of their stent, they were randomized to biweekly alirocumab 150 mg (another PCSK9 inhibitor) or placebo on top of rosuvastatin 20 mg for 52 weeks.
A critical detail: Most of these patients were statin-naïve at the time of their heart attack. Their plaques had never been exposed to lipid-lowering therapy, meaning the baseline lipid content and volume were at their natural, untreated state, giving the greatest possible room for improvement.
The imaging protocol: In two separate non-infarct coronary arteries , arteries that were NOT stented researchers deployed IVUS, NIRS, and OCT simultaneously at baseline and again at 52 weeks. This triple-modality approach had never been used in a large randomized trial before.
LDL achieved: Alirocumab group: 23.6 mg/dL. Placebo (rosuvastatin alone): 74.4 mg/dL.
The Results, Three Dimensions, Three Wins
IVUS (plaque volume): PAV fell by 2.13% in the alirocumab group versus 0.92% in placebo (p<0.001). 75% of alirocumab patients showed regression. This was the largest absolute PAV regression ever observed in a plaque imaging trial at the time.
NIRS (lipid core): Maximum lipid core burden index, measuring the concentration of cholesterol-rich lipid inside the plaque, fell by 79.42 in the alirocumab group versus 37.60 in placebo (p<0.001). More than double the lipid drainage from the plaque interior.
OCT (fibrous cap): Minimum fibrous cap thickness increased by 62.67 μm in the alirocumab group versus 33.19 μm in placebo (p=0.001). Nearly 60% greater cap thickening, making the plaques dramatically more stable.
Triple Regression and Clinical Outcomes
Researchers defined triple regression as simultaneous improvement on all three measures: PAV reduction, lipid core reduction, and fibrous cap thickening. They then compared clinical cardiovascular outcomes between patients who achieved all three versus those who did not.
8.3% vs. 18.2%
Event rates: triple regressors vs. non-regressors
More than half the rate of major cardiac events in patients who achieved all three improvements
Who achieved triple regression? It was predominantly the alirocumab patients. Alirocumab was an independent predictor of triple regression with an odds ratio of 2.83 , patients on alirocumab were nearly three times more likely to achieve all three improvements simultaneously.
The LDL threshold: Lead investigator Prof. Lorenz Räber specifically noted that patients achieving LDL below 50 mg/dL showed the greatest improvements across all three dimensions , the best plaque volume reduction, the largest lipid core shrinkage, and the greatest cap thickening. LDL below 50 was the sweet spot for triple regression.
PACMAN-AMI gave us the imaging version of a clinical outcomes trial. Triple regression, simultaneously improving all three dangerous dimensions of vulnerable plaque, was associated with cutting cardiac events by more than half. And it was primarily achieved by patients whose LDL was driven below 50 mg/dL with a PCSK9 inhibitor.
PAV -2.13% vs -0.92%. Lipid core cut by >double. Cap thickened 59% more. Triple regression → 8.3% vs 18.2% events. LDL <50 mg/dL drove the best results.
YELLOW III (2023) [ STABILIZING SILENT PLAQUES IN STABLE PATIENTS ]
The Big Question
Every major trial before YELLOW III enrolled patients with either obstructive coronary disease or recent heart attacks , people with confirmed, serious disease. But the majority of people with dangerous plaques have never had a heart attack. They have stable, non-obstructive lipid-rich plaques sitting silently in their coronary arteries, primed to rupture without warning. YELLOW III asked: can we find and stabilize these silent killers before they strike?
What They Did
137 patients scheduled for elective coronary angiography at Mount Sinai Hospital in New York were enrolled. After at least 4 weeks of maximally tolerated statin therapy, patients underwent detailed plaque imaging. Only patients who had a non-obstructive lesion (30-50% stenosis) that met specific high-risk criteria, fibrous cap thickness ≤120 μm AND lipid arc >90 degrees on OCT, were included. These were the most dangerous stable plaques: thin caps, large lipid cores, non-obstructive, and asymptomatic.
110 qualifying patients received evolocumab 140 mg every two weeks for 26 weeks, on top of existing statin therapy. All three imaging tools, OCT, NIRS, and IVUS, were used before and after treatment. Blood samples were also collected for groundbreaking transcriptomic analysis: looking at which genes were turned on or off in the blood cells in response to treatment.
The Results
48% → 13%
Thin-cap fibroatheroma (TCFA) prevalence before vs. after
The most dangerous rupture-prone plaque type, cut by nearly two-thirds in just 26 weeks
Fibrous cap thickness (OCT): Increased from 70.9 μm to 97.7 μm at 26 weeks, a mean increase of 26.8 μm, or a 38% improvement starting from an already dangerously thin baseline. 80% of patients showed cap thickening.
Lipid core (NIRS): Maximum LCBI4mm fell from 306.8 to 213.1, a reduction of roughly 30% in the lipid content of the most dangerous plaque segment. 78% of patients showed lipid reduction.
Plaque volume (IVUS): PAV fell by 1.38%, confirming that total plaque burden also regressed alongside the favorable compositional changes.
The Transcriptomic Discovery, The Future of Precision Cardiology
YELLOW III went further than any prior plaque trial by analyzing gene expression changes in peripheral blood cells, looking at which biological pathways were activated or suppressed by evolocumab treatment, and whether these patterns could predict who would benefit.
In responders (patients whose fibrous cap thickened and lipid core shrank): researchers found suppression of immune cell adhesion and inflammatory signaling pathways, restoration of mitochondrial energy production in immune cells, increased cell survival and protein synthesis. The drug was not just lowering a number, it was fundamentally reprogramming the inflammatory biology of the artery wall, detectable in the blood.
The non-responder problem, an important caveat: Approximately 20% of patients had their LDL driven into the 30s and 40s and still did not show meaningful fibrous cap thickening. Their plaques did not respond the way the other 80% did. This finding is clinically critical: LDL lowering is necessary but not always sufficient. Some patients appear to have a different inflammatory or genetic substrate that blunts their arterial response to lipid lowering.
Machine learning prediction: Using a panel of 38 genes, researchers trained a model that could predict individual fibrous cap response to evolocumab with an area under the curve of 0.97, extraordinarily accurate. This opens the door to a future blood test that could tell you, before the first injection is given, whether a particular patient is likely to respond to PCSK9 inhibitor therapy or whether a different approach, such as anti-inflammatory treatment, should be considered.
YELLOW III proved that even stable, asymptomatic patients with high-risk lipid-rich plaques, the silent majority of patients who carry dangerous disease but have never had a heart attack , can achieve dramatic plaque stabilization in just 26 weeks of aggressive lipid lowering. It also revealed that some patients will not respond regardless of how low their LDL goes, and that genomics will eventually guide us toward personalized therapy.
TCFA 48%→13% in 26 weeks. 80% cap responders. 78% lipid responders. ML model predicts response with AUC 0.97. ~20% are LDL-lowering nonresponders.
All NinePlaque Regression Trials Side by Side
|
Trial |
Year |
N |
Patients |
Imaging |
LDL Achieved |
Key Finding |
|
REVERSAL |
2004 |
502 |
Stable CAD |
IVUS |
79 mg/dL (atorva) vs 110 (prava) |
Atorvastatin halted progression; pravastatin progressed. First head-to-head statin intensity proof. |
|
ASTEROID |
2006 |
349 |
Stable CAD |
IVUS |
60.8 mg/dL |
First ever frank plaque regression with statin. PAV -0.98%. Regression in 64% of patients. |
|
SATURN |
2011 |
1,039 |
Stable CAD |
IVUS |
62.6 (rosuva) vs 70.2 (atorva) mg/dL |
Both high-intensity statins regressed plaque. Rosuvastatin slightly better on LDL and TAV. |
|
ESTABLISH |
2004 |
48 |
Post-ACS (PCI) |
IVUS |
Reduced 41.7% from baseline |
First trial showing rapid plaque regression after ACS in 6 months. Plaque -13.1% vs +8.7% control (p<0.001). |
|
PRECISE-IVUS |
2015 |
202 |
Post-PCI (ACS + stable) |
IVUS |
63.2 (combo) vs 73.3 (statin) mg/dL |
Statin + ezetimibe: PAV -1.4% vs -0.3%. Regression in 78% vs 58%. Dual blockade wins. |
|
GLAGOV |
2016 |
968 |
Stable CAD |
IVUS |
36.6 mg/dL (evolocumab+statin) |
Regression in 64% vs 47%. Linear benefit to LDL 20 mg/dL. No floor found. |
|
HUYGENS |
2022 |
161 |
Post-NSTEMI |
OCT + IVUS |
28.1 mg/dL (evolocumab+statin) |
Cap thickening +42.7 vs +21.5 μm. ApoB <65 mg/dL drove nearly double benefit. |
|
PACMAN-AMI |
2022 |
300 |
Post-AMI |
IVUS+NIRS+OCT |
23.6 mg/dL (alirocumab+statin) |
Triple regression. 8.3% vs 18.2% event rate in triple vs non-triple regressors. |
|
YELLOW III |
2023 |
110 |
Stable CAD (non-obstructive) |
OCT+NIRS+IVUS |
~30-40s mg/dL (evolocumab+statin) |
TCFA 48%→13%. 80% cap responders. Transcriptomics identifies nonresponders. |
The LDL Target Discussion: Why Below 60 Matters, and Why Below 40 Is Even Better
This section is the most important takeaway from all eight trials combined. I want you, and your doctor, to understand why the numbers on your lipid panel are not just a formality. They determine whether your arteries are actively healing or slowly deteriorating.
The Historical Movement of LDL Targets
In the 1980s and 1990s, a total cholesterol below 200 mg/dL was considered acceptable by most guidelines. LDL targets did not become central until the statin era.
REVERSAL (2004) showed that LDL at 79 mg/dL halted progression. ASTEROID (2006) showed that LDL at 60.8 mg/dL produced regression. SATURN (2011) confirmed regression at 62-70 mg/dL across 1,039 patients. PRECISE-IVUS (2015) showed more regression when LDL reached 63.2 versus 73.3 mg/dL. GLAGOV (2016) showed regression at LDL as low as 20 mg/dL with no floor. PACMAN-AMI (2022) showed that LDL below 50 produced the most dramatic triple regression. HUYGENS (2022) showed that ApoB below 65 mg/dL , not just a raw LDL number , best predicted plaque stabilization.
The direction across 20 years of imaging data is unmistakably consistent: lower is better, with no identified floor within the range studied.
What Happens at LDL Below 60 mg/dL, The Biology Shifts
The physics of cholesterol in the artery wall helps explain why 60 mg/dL is a meaningful threshold. Cholesterol enters the artery wall through LDL particles that penetrate the endothelium (the inner lining of the artery). Once inside, some of it is cleared by HDL particles in a process called reverse cholesterol transport. For many years, the rate of cholesterol entering the wall exceeded the rate it was being removed , net accumulation. Plaque grows.
As circulating LDL falls, the concentration gradient driving cholesterol into the wall decreases. At the same time, statins and PCSK9 inhibitors upregulate LDL receptors on the liver, increasing cholesterol clearance from the bloodstream. Around 60-70 mg/dL, the balance starts to shift. The net flow of cholesterol begins to reverse. More cholesterol leaves the plaque than enters it. This is plaque regression.
The imaging trials confirm this biology precisely: REVERSAL at 79 mg/dL , zero regression, just halt. ASTEROID at 60.8 mg/dL , frank regression. The threshold is real, it is biological, and it sits somewhere between 70 and 60 mg/dL for most patients.
Below 60 mg/dL, you cross a biological threshold where cholesterol begins flowing OUT of plaques faster than it flows in. Above this level, it's closer to a standoff , disease is slowed but not reversed. This is why the 2024 European guidelines set a target of 55 mg/dL for very high-risk patients. The 60 mg/dL figure from ASTEROID was not arbitrary. It is the biologically meaningful floor of the regression zone.
What Happens Below 40 mg/dL, Regression Accelerates
GLAGOV, HUYGENS, and PACMAN-AMI all drove LDL into territory that was pharmacologically impossible before PCSK9 inhibitors: mean LDL values of 36.6, 28.1, and 23.6 mg/dL respectively. In all three trials, plaque regression was greater than anything seen in the statin-only trials.
The key data points:
- GLAGOV: Continuous linear dose-response between lower LDL and more regression, extending to LDL 20 mg/dL. No plateau identified.
- PACMAN-AMI: Prof. Räber specifically reported that LDL below 50 mg/dL drove the best results on all three simultaneous measures , volume, lipid core, and cap thickness. Below 50 was the threshold for triple regression.
- HUYGENS: Lower achieved LDL correlated directly with greater fibrous cap thickening in a continuous proportional relationship. The lowest-LDL patients had the thickest caps at 52 weeks.
Taken together, the data show a clear stepwise relationship: regression at 60 mg/dL, more regression at 50 mg/dL, and the most dramatic, consistent triple regression below 40 mg/dL. The relationship is linear. Every 10 mg/dL matters.
No floor identified
Plaque regression continued in direct proportion to LDL reduction
Down to LDL as low as 20 mg/dL in GLAGOV, with no identified lower limit of benefit
Is It Safe to Go That Low?
The safety data from all eight trials is reassuring. In GLAGOV, HUYGENS, and PACMAN-AMI , trials that averaged LDL in the 20s and 30s , adverse event rates were low and comparable to placebo arms. No excess of diabetes, serious muscle problems, or neurocognitive impairment was observed at these LDL levels.
The concern about cholesterol being "essential for cell function" is biologically misapplied here. Every cell in the body synthesizes its own cholesterol independently of circulating LDL. Your brain, liver, red blood cells, adrenal glands , all have their own synthesis pathways that continue operating normally regardless of how low plasma LDL is driven. Driving blood LDL to 25-30 mg/dL does not deprive your cells of cholesterol. It reduces the amount of atherogenic particles circulating in the bloodstream and depositing in artery walls.
Population genetics confirms this: People born with naturally very low LDL due to PCSK9 loss-of-function mutations , naturally occurring PCSK9 deficiency , have LDL levels in the 10-40 mg/dL range from birth. They show no excess of cancer, hormonal problems, or cognitive impairment, and have dramatically lower rates of cardiovascular disease.
Very low LDL , in the 20s and 30s , is safe in the short and medium term based on all available imaging trial data. The theoretical concern about cellular cholesterol depletion does not hold up scientifically, because cells make their own cholesterol independently of plasma LDL.
The ApoB Correction: Why LDL Alone Is Not Enough
HUYGENS introduced the most important refinement in how we should think about lipid targets: ApoB, not LDL-C, was the best predictor of plaque response.
Here is why this matters clinically. LDL-C measures the cholesterol content inside LDL particles. ApoB measures the number of atherogenic particles, each VLDL, IDL, LDL, and Lp(a) particle carries exactly one ApoB molecule. In a patient with normal lipid metabolism, LDL-C and ApoB track closely. But in a patient with insulin resistance, elevated triglycerides, metabolic syndrome, or diabetes, you can have a normal or low LDL-C but a high number of small, dense LDL particles, each carrying little cholesterol but just as capable of penetrating the artery wall and depositing there. Their ApoB will be high even when their LDL-C appears controlled.
The HUYGENS finding: Patients who achieved ApoB below 65 mg/dL had nearly double the fibrous cap thickening (+44.6 vs. +24.9 μm) and nearly double the lipid arc reduction (-57.8 vs. -27.0 degrees) compared to those who did not, regardless of which treatment they were on.
What this means in practice: A patient whose LDL-C reaches 58 mg/dL on rosuvastatin may feel their lipid management is complete. But if their ApoB is 80 mg/dL , still above goal , there is significant residual atherogenic particle burden in their bloodstream continuing to drive plaque biology. That patient likely needs additional therapy, intensified statin, ezetimibe, or a PCSK9 inhibitor, to bring ApoB below 65 mg/dL.
LDL-C tells you the weight of the cargo. ApoB tells you how many delivery trucks are on the road. HUYGENS proved that the number of trucks , not just their load , determines how much arterial damage is being done, and how much can be undone with treatment. Measure ApoB. Target ApoB.
The Non-Responder Caveat
YELLOW III introduced an important clinical reality: about 20% of patients will not respond to LDL lowering in the expected way. Their plaques will not thicken their fibrous caps meaningfully, even when LDL is driven into the 30s and 40s.
The transcriptomic data from YELLOW III suggests this reflects differences in the underlying inflammatory biology of the artery wall, specifically, whether the mitochondrial and immune-pathway changes that drive plaque stabilization are occurring. A 38-gene blood signature predicted response with near-perfect accuracy (AUC 0.97), which is more accurate than any single lipid marker.
We are not yet at the point where this blood test is commercially available or routinely used. But the research direction is clear: within the next decade, clinicians will likely have access to a simple blood test that predicts who will respond maximally to PCSK9 inhibitor therapy and who needs an alternative or additional anti-inflammatory strategy, such as colchicine, targeting IL-6, or novel inflammation pathways. Precision cardiology for plaque regression is coming.
Plaque Regression Bottom Line: Can We Reverse Heart Disease?
Heart disease is not a one-way street. All eight trials, taken together, have proved this beyond scientific doubt.
REVERSAL showed that the intensity of statin therapy matters at the artery wall , high-intensity halts progression, moderate does not. ASTEROID proved for the first time that driving LDL to 60.8 mg/dL causes frank plaque regression. SATURN confirmed regression is reproducible across 1,039 patients on either maximum-dose statin. PRECISE-IVUS showed that adding ezetimibe, blocking gut absorption on top of hepatic synthesis, drives LDL lower and produces proportionally more regression.
GLAGOV showed that with PCSK9 inhibitors the benefit continues linearly all the way to LDL 20 mg/dL with no identified floor. HUYGENS showed that structural stabilization of the most dangerous plaque characteristics, cap thickening, lipid drainage, inflammation reduction , is achievable after a heart attack, and that ApoB below 65 is the target that predicts the best response. PACMAN-AMI showed that triple regression, simultaneously improving volume, lipid content, and cap thickness, cuts clinical events by more than half, and is primarily achieved at LDL below 50 mg/dL. And YELLOW III showed that even stable, asymptomatic patients with dangerous silent plaques can achieve dramatic stabilization in 26 weeks, while revealing the 20% of patients who need a fundamentally different approach.
The numbers that matter:
- Below 70 mg/dL LDL: Disease slows significantly.
- Below 60 mg/dL LDL: Regression begins reliably , the biology shifts from accumulation to clearance.
- Below 50 mg/dL LDL: Regression becomes more dramatic; triple regression possible.
- Below 40 mg/dL LDL: Maximum plaque regression observed; continuous linear benefit down to 20 mg/dL.
- Below 20 mg/dL LDL: Safe and even more regresison
- ApoB below 65 mg/dL: The particle-based target that predicts the most structural improvement, especially in post-ACS patients.
The conversation to have with your doctor is not "is my cholesterol normal." It is: "What is my LDL? What is my ApoB? Am I on the right therapy at the right dose to get to the levels where my arteries can actually heal?"
The lower you go, the more your arteries heal. The evidence is consistent across eight trials, 20 years, and more than 4,000 patients with cameras inside their coronary arteries. The question is not whether the science supports aggressive lipid lowering. It does, overwhelmingly. The question is whether your treatment plan does.
References
1. REVERSAL (2004) Nissen SE, et al. Effect of intensive compared with moderate lipid-lowering therapy on progression of coronary atherosclerosis. JAMA. 2004;291(9):1071-1080. PubMed: https://pubmed.ncbi.nlm.nih.gov/14996776/ DOI: https://doi.org/10.1001/jama.291.9.1071
2. ASTEROID (2006) Nissen SE, Nicholls SJ, Sipahi I, et al. Effect of very high-intensity statin therapy on regression of coronary atherosclerosis: the ASTEROID trial. JAMA. 2006;295(13):1556-1565. PubMed: https://pubmed.ncbi.nlm.nih.gov/16533939/ DOI: https://doi.org/10.1001/jama.295.13.jed60019
3. SATURN (2011) Nicholls SJ, Ballantyne CM, Barter PJ, et al. Effect of two intensive statin regimens on progression of coronary disease. N Engl J Med. 2011;365(22):2078-2087. PubMed: https://pubmed.ncbi.nlm.nih.gov/22085316/ DOI: https://doi.org/10.1056/NEJMoa1110874
4. PRECISE-IVUS (2015) Tsujita K, Sugiyama S, Sumida H, et al. Impact of dual lipid-lowering strategy with ezetimibe and atorvastatin on coronary plaque regression in patients with percutaneous coronary intervention: the PRECISE-IVUS trial. J Am Coll Cardiol. 2015;66(5):495-507. PubMed: https://pubmed.ncbi.nlm.nih.gov/26227186/ DOI: https://doi.org/10.1016/j.jacc.2015.05.065
5. GLAGOV (2016) Nicholls SJ, Puri R, Anderson T, et al. Effect of evolocumab on progression of coronary disease in statin-treated patients: the GLAGOV randomized clinical trial. JAMA. 2016;316(22):2373-2384. PubMed: https://pubmed.ncbi.nlm.nih.gov/27846344/ DOI: https://doi.org/10.1001/jama.2016.16951
6. HUYGENS (2022) Nicholls SJ, Kataoka Y, Nissen SE, et al. Effect of evolocumab on coronary plaque phenotype and burden in statin-treated patients following myocardial infarction. JACC Cardiovasc Imaging. 2022;15(8):1308-1321. PubMed: https://pubmed.ncbi.nlm.nih.gov/35431172/ DOI: https://doi.org/10.1016/j.jcmg.2022.03.002
7. PACMAN-AMI (2022) Räber L, Ueki Y, Otsuka T, et al. Effect of alirocumab added to high-intensity statin therapy on coronary atherosclerosis in patients with acute myocardial infarction: the PACMAN-AMI randomized clinical trial. JAMA. 2022;327(18):1771-1781. PubMed: https://pubmed.ncbi.nlm.nih.gov/35368058/ DOI: https://doi.org/10.1001/jama.2022.5218
8. YELLOW III (2023/2025) Kini AS, et al. Intracoronary imaging and transcriptomic characteristics before and after maximum lipid-lowering therapy: YELLOW-III study of evolocumab and maximum statin therapy in chronic coronary disease. JACC Cardiovasc Imaging. 2025. PubMed: https://pubmed.ncbi.nlm.nih.gov/41758107/ DOI: https://doi.org/10.1016/j.jcmg.2025.12.013
9. ESTABLISH: Okazaki S, et al. Early statin treatment in patients with acute coronary syndrome. Circulation. 2004;110(9):1061-1068. PubMed: https://pubmed.ncbi.nlm.nih.gov/15326073/ DOI: https://doi.org/10.1161/01.CIR.0000140261.58966.A4
Still Have Questions? Stop Googling and Ask Dr. Alo.
You’ve read the science, but applying it to your own life can be confusing. I created the Dr. Alo VIP Private Community to be a sanctuary away from social media noise.
Inside, you get:
-
Direct Access: I answer member questions personally 24/7/365.
-
Weekly Live Streams: Deep dives into your specific health challenges.
-
Vetted Science: No fads, just evidence-based cardiology and weight loss.
Don't leave your heart health to chance. Get the guidance you deserve. All this for less than 0.01% the cost of health insurance! You can cancel at anytime!
[👉 Join the Dr. Alo VIP Community Today]
Cardiology & Obesity Medicine